If you have a business, you have a funnel. That’s the set of steps a customer has to go through to convert your visitors into customers. If you’re an e-commerce store, your funnel has steps like viewing a product and adding it to a shopping cart. If you offer memberships, your funnel might extend past the signup to steps like logging in and using specific features of your service.
Whatever that funnel is, you can now start optimizing it with Improvely. The new Conversion Funnel report is here, and it makes visualizing and drilling into your funnels a snap.
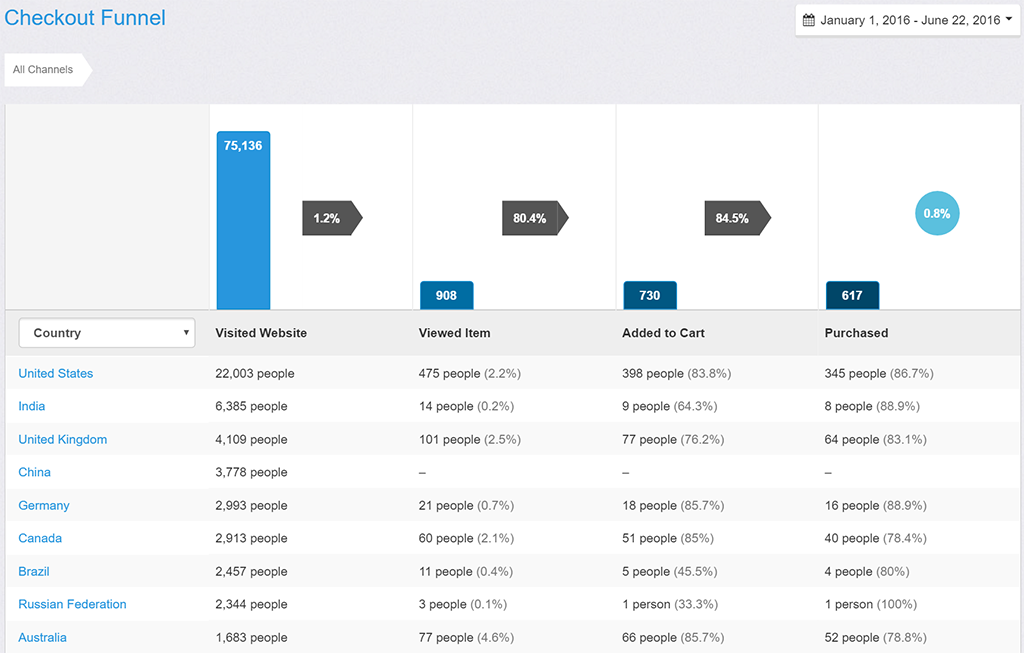
You can build a custom funnel that visualizes the steps customers in your specific business need to complete, and it’ll populate with data instantly. You don’t have to pre-define funnels before collecting data like some platforms. You’ll be able to tell at a glance where your potential customers are dropping off, and identify these holes in your funnel that need extra attention to maximize conversion.
Each step in your funnel is visualized with a column chart, with arrows showing the percentage of people from each step that completed the one following. Under the chart, you can segment your traffic by all the dimensions you’re familiar with from our other reports — channel, source, campaign, medium, ad content, referrer, landing page, keyword, device type and location.
The funnel report is a new feature available in all plans today.
We’re excited to add a powerful new metric to your dashboards and reports: converted people.
We’ve always tracked conversions, but starting today, you can separately see how many unique people converted as well. When your store’s newest customer places 3 orders the same afternoon, you’ll see all 3 conversions in the conversion column of your reports, but your converted people column will only go up by 1. This gives you a better idea of what percentage of your traffic from each ad campaign or other source is converting in addition to your other metrics like how much revenue they’ve generated.
Going forward, your conversion rate will be calculated by dividing the number of converted people by the number of people acquired from each source. As you’d expect, this new metric is available in all your dashboards and reports immediately, and plays well with the conversion goal selector and other filters available.
You’ve long been able to choose a conversion goal at the top of any report, getting conversion and revenue metrics specific to that goal. We’ve received many requests to select more than one goal at once so that you can see metrics for groups of conversion goals, and now you can do just that!
Now you get all the benefit of specific conversion goals, like differentiating between signups to different mailing lists, while being able to measure the conversion rate of any traffic source to all the goals you’re interested in at once. The new goal selection box even filters long lists of goal names as you type to find those you’re interested in super quick.
This week we rolled out some exciting updates to Improvely …
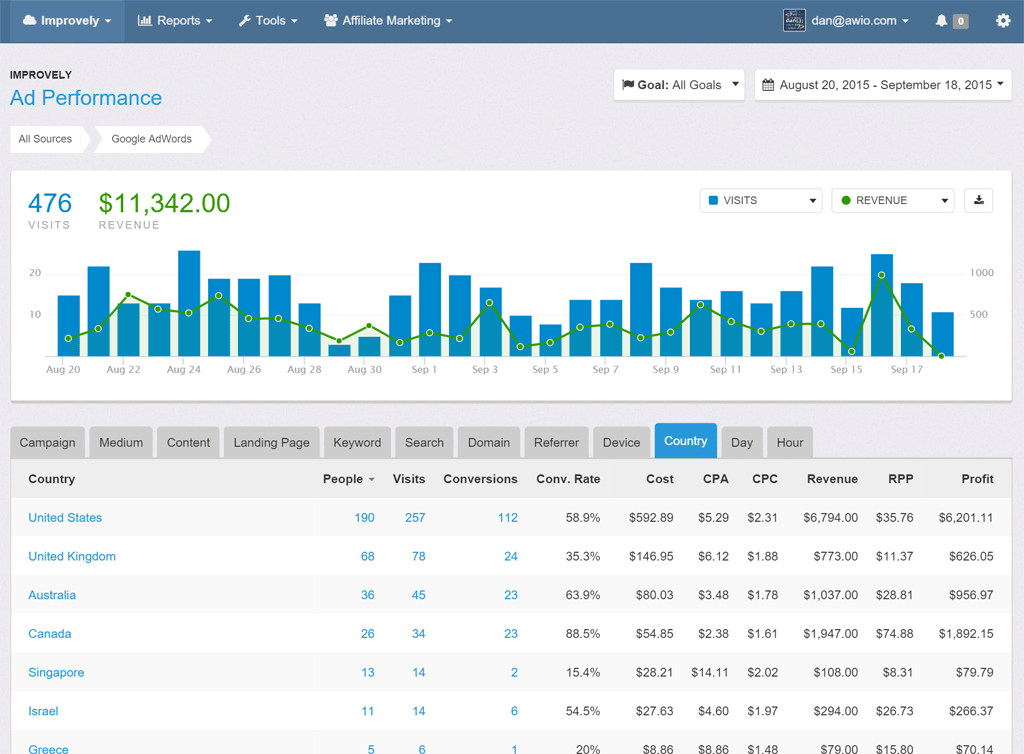
Enhanced Charts with Custom Metrics and Downloads
Your overview and traffic reports now include updated, customizable charts. You can choose your own metrics to display instead of only people and conversions. You can also download any chart as a spreadsheet with every metric broken out by date by clicking the download button at the top right.
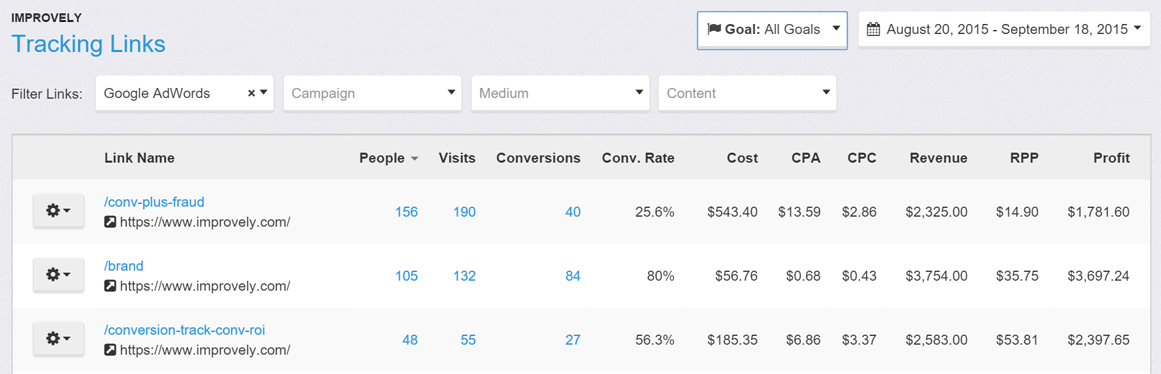
Improved Tracking Link Management
We’ve gotten a lot of feedback about how difficult it could be to manage lots of tracking links for all your different ads and marketing campaigns. Because campaign tags were stuffed into narrow columns the link names and labels often got cut off. You also couldn’t easily see which landing page each of your tracking links pointed to, which can be super important to finding the right link quickly when you want to share it or clone it again.
We’ve taken that feedback to heart and completely revamped the Tracking Links report and the Manage Tracking Links pages. You can now see your whole link name, and the landing page each link points to without clicking through to another page.
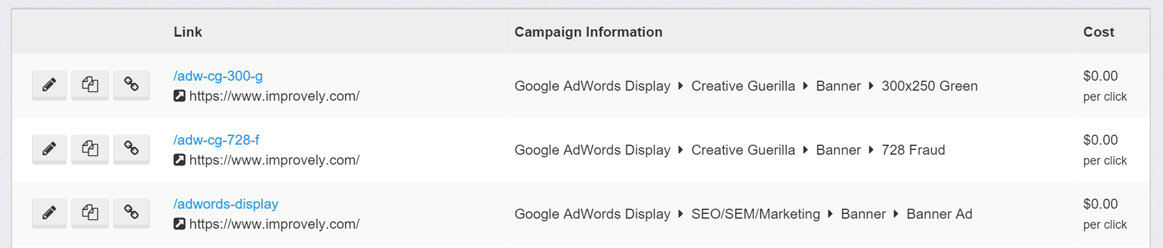
You can also see all your campaign information on the management page no matter how long it is.
Fresh Paint All Round
We also took some time to improve the appearance and readability of many of the reports, with larger fonts and spacing so everything’s easier to read at a glance, and more clear navigation.
Plus, two dozen small tweaks to make your life easier, like searchable goal names in the goal selection at the top of reports, auto-generating new link names when you clone a tracking link, additional shortcuts to the most used reports, and much more.
We hope these changes make Improvely even more enjoyable to use, and more valuable to you and your clients. We’re hard at work on additional features due out this fall!
Improvely creates a profile for every individual person that views your website. That profile keeps track of all their past visits, purchases and other activity with you. We’ve just enhanced those profiles with bigger avatars, more key metrics, and a clearer timeline of events.
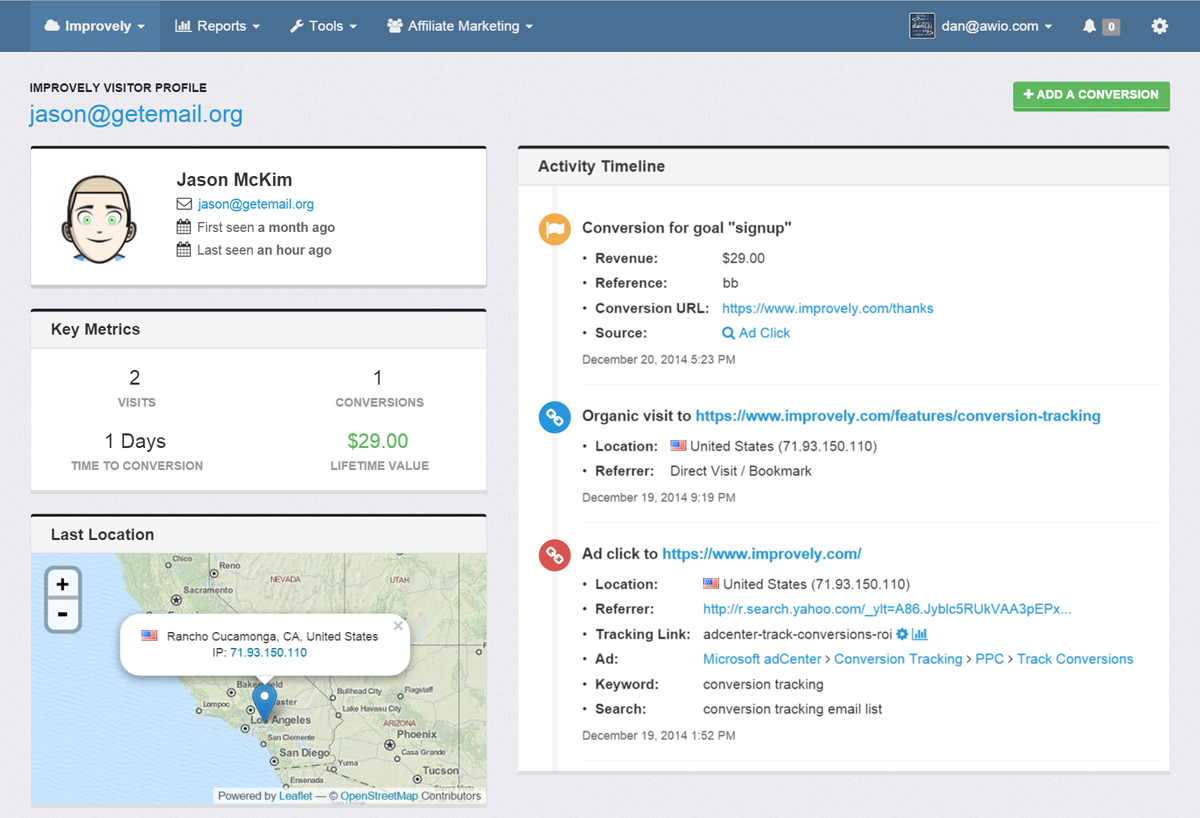
You can find the profiles of your visitors by clicking on the number in the people column of any report, or using the People Explorer tool.
We’ve also upgraded our visitor labeling feature so that you can attach names and e-mails to these profiles whenever you can identify a visitor on your website — such as after someone makes a purchase or fills out a contact form. It’s as easy as including name and e-mail parameters when including the labeling code in your webpage:
<script type="text/javascript">
improvely.label({
  label: 'dangrossman1',
  name: 'Dan Grossman',
  email: 'dan@awio.com'
});
</script>